Non farm payroll forecast for February – new trends in the labor market and economic outlook
- March 4, 2025
- Posted by: Macro Global Markets
- Category: News

1、 Non farm Summary: Data Divergence and Market Focus
The non farm payroll data for February 2025 faces two core variables:
Verification of labor market resilience: In January, there were 143000 new non farm jobs added (previously revised up to 307000), and the unemployment rate dropped to 4.0%. However, wage growth exceeded expectations (4.1% year-on-year), causing inflation concerns. The market needs to verify whether the February data continues the combination of “strong employment+high wages” or shows signs of economic slowdown.
Impact of Historical Data Revision: The US Department of Labor will conduct an annual benchmark revision on household survey data, with an expected increase of 3.5 million in net immigration data for 2023-2024 and a significant increase of 2.3 million in household employment data. This may lead to a narrowing of the long-term gap between non-agricultural and household employment data, triggering a reassessment of the true strength of the labor market in the market.
Newly added employment: Market forecast of 153000 (previous value of 143000).

2、 Interpretation of Small Non Agricultural ADP and Big Non Agricultural Data
Small Non Agricultural ADP Forecast
Previous value: January ADP employment of 183000;
Forecast value: ADP expected to be 140000 in February (market concerns about high interest rates suppressing recruitment for small and medium-sized enterprises).
ADP data reflects the employment situation of small and medium-sized enterprises. In January, ADP added 183000, far exceeding the 143000 in non farm sectors, indicating that layoffs by large enterprises (such as the technology industry) coexist with the expansion of enrollment by small and medium-sized enterprises. If ADP falls back to 140000 in February, it may indicate that small and medium-sized enterprises are affected by the credit crunch and the momentum of the job market is declining.
The ADP employment figures for February will be announced on Wednesday, March 5th, 2025 at 21:15.

Core indicators for non-agricultural sectors
New non farm employment: forecast of 153000 (previous value of 143000);
Unemployment rate: expected to remain at 4.0%, if unexpectedly rises to 4.1%, it will strengthen the expectation of interest rate cuts;
Salary growth rate: If the year-on-year growth rate exceeds 4.0%, it may exacerbate concerns about the “wage inflation spiral” and support the strengthening of the US dollar.
Review of Non farm Impact Last Month: After the release of January data, gold briefly fell to $2888, but rebounded to $2917 in the late trading session due to a long short game caused by the contradiction between the decline in unemployment rate and wage growth.
The data on changes in non farm employment population for February will be released on March 7, 2025 (Friday) at 21:30
(1) Non farm payroll data falls short of expectations: weak US job market, bearish for the US dollar, bullish for gold;
(2) Non farm payroll data exceeds expectations: the US job market is good, positive for the US dollar, negative for gold.
Historical non farm payroll data chart

Trend analysis: Non farm payroll data has fluctuated sharply in the past three months, with significant corrections (such as an upward adjustment of 164000 before January), highlighting the complexity of labor market statistics
3、 Differences in forecasts between institutions and banks
Goldman Sachs (120000): Structural weakness dominates
Core basis: The lag effect of high interest rates is accelerating, and the job vacancy of JOLTS in January has dropped to 8.6 million (previously 8.9 million), indicating a cooling demand for corporate recruitment;
Correction impact: The upward revision of 2.3 million household survey data will lead to a “statistical decrease” in the unemployment rate, but the actual labor market may be weaker than the surface data;
Industry weight: It is expected that the manufacturing industry will decrease by 15000, the construction industry will remain stable, and the service industry’s new growth will slow down to 135000.
Moody’s (180000): Resilience Support for the Service Industry
Logical chain: healthcare (+60000), education services (+30000), and government employment (+40000) remain strong, offsetting the decline in manufacturing;
Immigration effect: Revised immigration data or explanations account for about 40% of new employment, masking the weakness of the local labor market;
Cycle positioning: It is believed that the US economy is in the “late stage of expansion” rather than on the eve of recession, and there is still inertia in the demand for employment in enterprises.
Citigroup (125000): Credit crunch spreads to employment
Financial conditions: The interest rate of BBB rated corporate bonds has risen to 6.7% (average of 5.2% in 2024), and the rising financing costs for small and medium-sized enterprises have suppressed the expansion of enrollment;
Leading indicator: In February, the number of layoffs by challenger companies increased by 35% year-on-year, and the wave of layoffs in the technology and retail industries spread;
Policy correlation: If the data is below 130000, it will strengthen the expectation of a 50 basis point interest rate cut by the Federal Reserve in June.
4、 Interpretation of Gold and Silver Market Trends
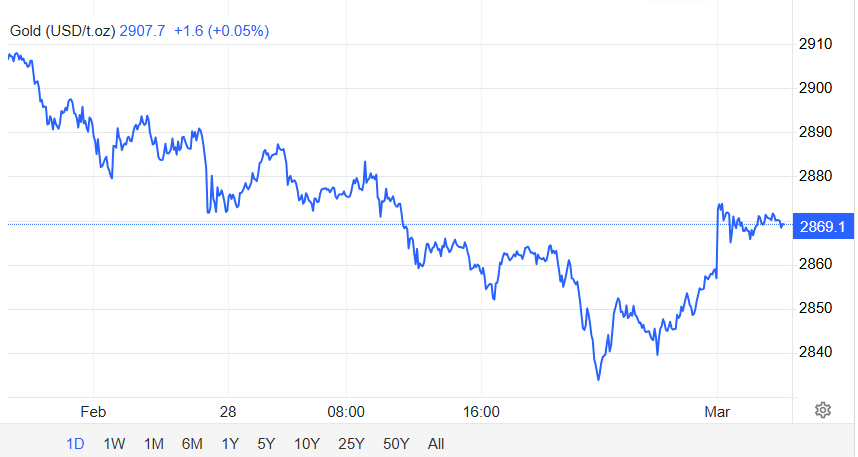
Analysis of the Gold Market
Due to weak US economic data (new housing starts in January and initial jobless claims are less than expected) and the policy divergence of the Federal Reserve, risk appetite is suppressed, while the geopolitical situation (Russia-Ukraine conflict, Red Sea shipping crisis) and Trump’s tariff policy disturbance aggravate risk aversion volatility.
Technically speaking, the golden Asian session rebounded from the low of $2921.34 to $2944.00, with the daily average still holding steady at the 20 day moving average ($2925.00). However, the 4-hour chart’s Bollinger Bands narrowed to the range of $2930.00-2945.00, and the shortening of the MACD momentum column suggests an intensification of long short trading. The key resistance above is at $2955.00 (three attempts within the year have not broken), and breaking through may open up an upward space of $3000.00; The strong support below is at $2900.00 (daily cloud base+central bank cost line).
In terms of short-term operations, sell high and buy low in the range of 2930.00-2945.00 US dollars, break through 2955.00 US dollars and chase long, with a target of 2980.00-3000.00 US dollars; If it breaks below $2920.00, it can be shorted to $2900.00 with a stop loss of $5.
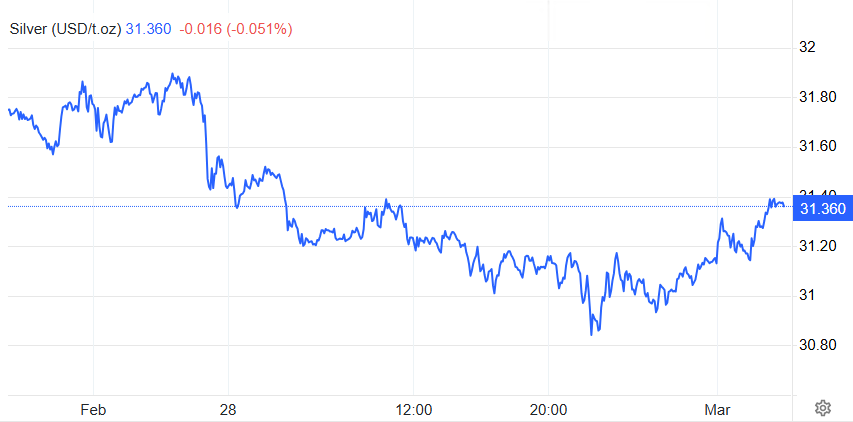
Analysis of the Silver Market
Due to the industrial nature of silver, it is more sensitive to economic cycles, and the weak manufacturing PMI (47.3) suppresses demand expectations, but the growth in demand in the photovoltaic and new energy sectors forms a hedge. The risk aversion sentiment and gold linkage remain the short-term dominant factors.
From a technical perspective, silver has rebounded to $32.590 after testing support at $32.350. The hourly chart is constrained by resistance at $32.780 and requires a breakthrough to confirm a trend reversal. The daily average is approaching the 20 day moving average ($32.150), and if it effectively falls below the psychological level of $32.000, it may open up a downward space towards $31.300.
Operation suggestion: Operate in the range of 32.350-32.780 US dollars, break through 32.780 US dollars and chase after the high to 33.200 US dollars; Fall below $32000 and go short, target $31.300 with a stop loss of $0.200.
Note: Attention should be paid to the amplification of gold silver linkage fluctuations during non farm weeks. If the unemployment rate rebounds beyond expectations or wage growth slows down, it may trigger a resonance market in precious metals.
5、 Non farm weekly related market trends
March 4th: JOLTS job vacancies in the United States
Predicted value: 8.55 million (previous value 8.86 million)
Impact path: If it falls below 8.5 million, it will strengthen the narrative of “rebalancing of labor supply and demand”, indicating a downward trend in wage growth and benefiting gold;
Historical correlation: The 90 day correlation between JOLTS data and non farm employment growth is 0.68.
March 5th: ISM Non Manufacturing PMI
Predicted value: 53.5 (previous value 54.2)
Sector mapping: The service industry accounts for over 80% of the US GDP. If the reading falls below 53, it will exacerbate concerns about economic slowdown and hedge against optimistic sentiment towards non farm sectors;
Gold sensitivity: For every 1 point below expected PMI, gold may rise by 8-10 US dollars in the short term.
Trading risk warning: Any investment carries risks, including the risk of financial loss. This suggestion does not constitute specific investment advice, and investors should make decisions based on their risk tolerance, investment goals, and market conditions.